How to Trade with Moving Average (MA) - Algo Trading Example
How to Trade with moving average
What is moving average in trading?
A moving average is a technical analysis tool that helps to smooth out price fluctuations and identify trends in financial markets. It is calculated by taking the average price of a security over a certain number of periods, and then plotting it on a chart. The most common moving averages are the simple moving average (SMA), which is calculated by taking the sum of the closing prices over a certain number of periods and dividing it by the number of periods, and the exponential moving average (EMA), which gives more weight to recent prices. In trading, moving averages can be used to identify trends, identify potential entry and exit points, and to smooth out volatility in the market.
Types of moving average in trading
Simple Moving Average (SMA) - This type of moving average is calculated by taking the sum of a set number of past price data points and dividing it by the number of points included in the calculation. The result is a smoothed out representation of the price action.
Exponential Moving Average (EMA) - This type of moving average puts more weight on recent price data, making it more responsive to changes in the market. It is calculated using a formula that incorporates both the current price and the previous moving average value.
Weighted Moving Average (WMA) - This type of moving average gives more weight to recent price data, similar to the EMA. However, it uses a different formula to assign weights to the different price data points included in the calculation.
Triple Moving Average (TMA) - This type of moving average combines three moving averages of different lengths to create a smoother, more reliable representation of the price action.
Triple Exponential Moving Average (TEMA) - This type of moving average is similar to the TMA, but it uses exponential moving averages instead of simple moving averages. It is intended to be more responsive to changes in the market and reduce lag.
How to Trade with moving average
- Identify the trend: Use a longer-term moving average (such as a 50-day or 200-day moving average) to determine the overall trend of the market. If the moving average is pointing upwards, the market is in an uptrend, and if it is pointing downwards, the market is in a downtrend.
- Use a shorter-term moving average: Use a shorter-term moving average (such as a 10-day or 20-day moving average) to identify shorter-term trends and potential entry and exit points.
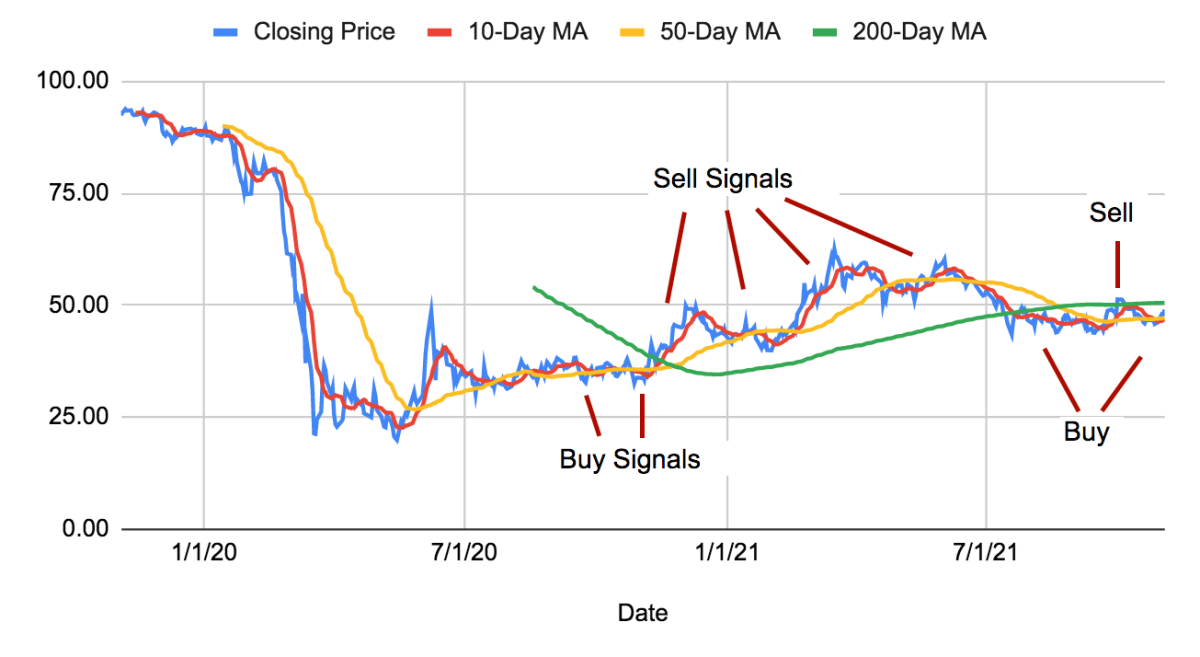
- Enter a trade: When the shorter-term moving average crosses above the longer-term moving average, it can signal a buy opportunity. Conversely, when the shorter-term moving average crosses below the longer-term moving average, it can signal a sell opportunity.
- Place a stop loss: It is important to protect your trades with a stop loss order, which will automatically sell your position if the market moves against you by a certain amount. The stop loss should be placed below the entry price for a long trade, and above the entry price for a short trade.
- Monitor the trade: Monitor the trade as it progresses and adjust your stop loss if necessary to protect your profits. You can also consider taking profits at predetermined levels or if the market changes direction.
- Use multiple moving averages: Some traders use multiple moving averages to confirm trends and identify potential entry and exit points. For example, you may use a combination of a 10-day and 20-day moving average to identify short-term trends, and a 50-day and 200-day moving average to identify longer-term trends.
200 Moving Average - 200MA
Top Trading Strategy based on Moving Average with Algo Code
def golden_cross(prices, short_ma, long_ma): # Calculate the short and long moving averages short_ma_values = moving_average(prices, short_ma) long_ma_values = moving_average(prices, long_ma) # Initialize a list to store the trading signals signals = [] # Loop through the prices and moving average values for i in range(len(prices)): # If the short moving average is above the long moving average, append a "buy" signal to the signals list if short_ma_values[i] > long_ma_values[i]: signals.append("buy") # If the short moving average is below the long moving average, append a "sell" signal to the signals list elif short_ma_values[i] < long_ma_values[i]: signals.append("sell") # If the moving averages are equal, append a "hold" signal to the signals list else: signals.append("hold") return signalsTo use this strategy, you would call the golden_cross function and pass in a list of prices and the desired values for the short and long moving averages. The function will then return a list of "buy," "sell," or "hold" signals for each point in the price series.
Post a Comment